Introduction
In 2025, User Satisfaction Survey continues to be a critical determinant of success for digital platforms, products, and services. Businesses are increasingly investing in user satisfaction surveys to measure performance, understand user needs, and drive actionable improvements. However, measuring satisfaction is not just about collecting feedback—it’s about knowing what metrics actually matter.
In this blog, we break down the most important user satisfaction survey benchmarks you need to track in 2025 to define success, along with strategies to improve and interpret these metrics using tools like PollHit.
Why User Satisfaction Surveys Matter More Than Ever

Growing Competition and User Expectations
As users become more tech-savvy and choices expand, even a minor inconvenience can lead to churn. Businesses must constantly monitor satisfaction levels to retain users.
Impact on Retention and Revenue
Higher satisfaction often correlates directly with improved retention rates and customer lifetime value (CLV). Companies that listen and adapt grow faster.
See why customer experience impacts ROI
Key User Satisfaction Survey Metrics to Track in 2025
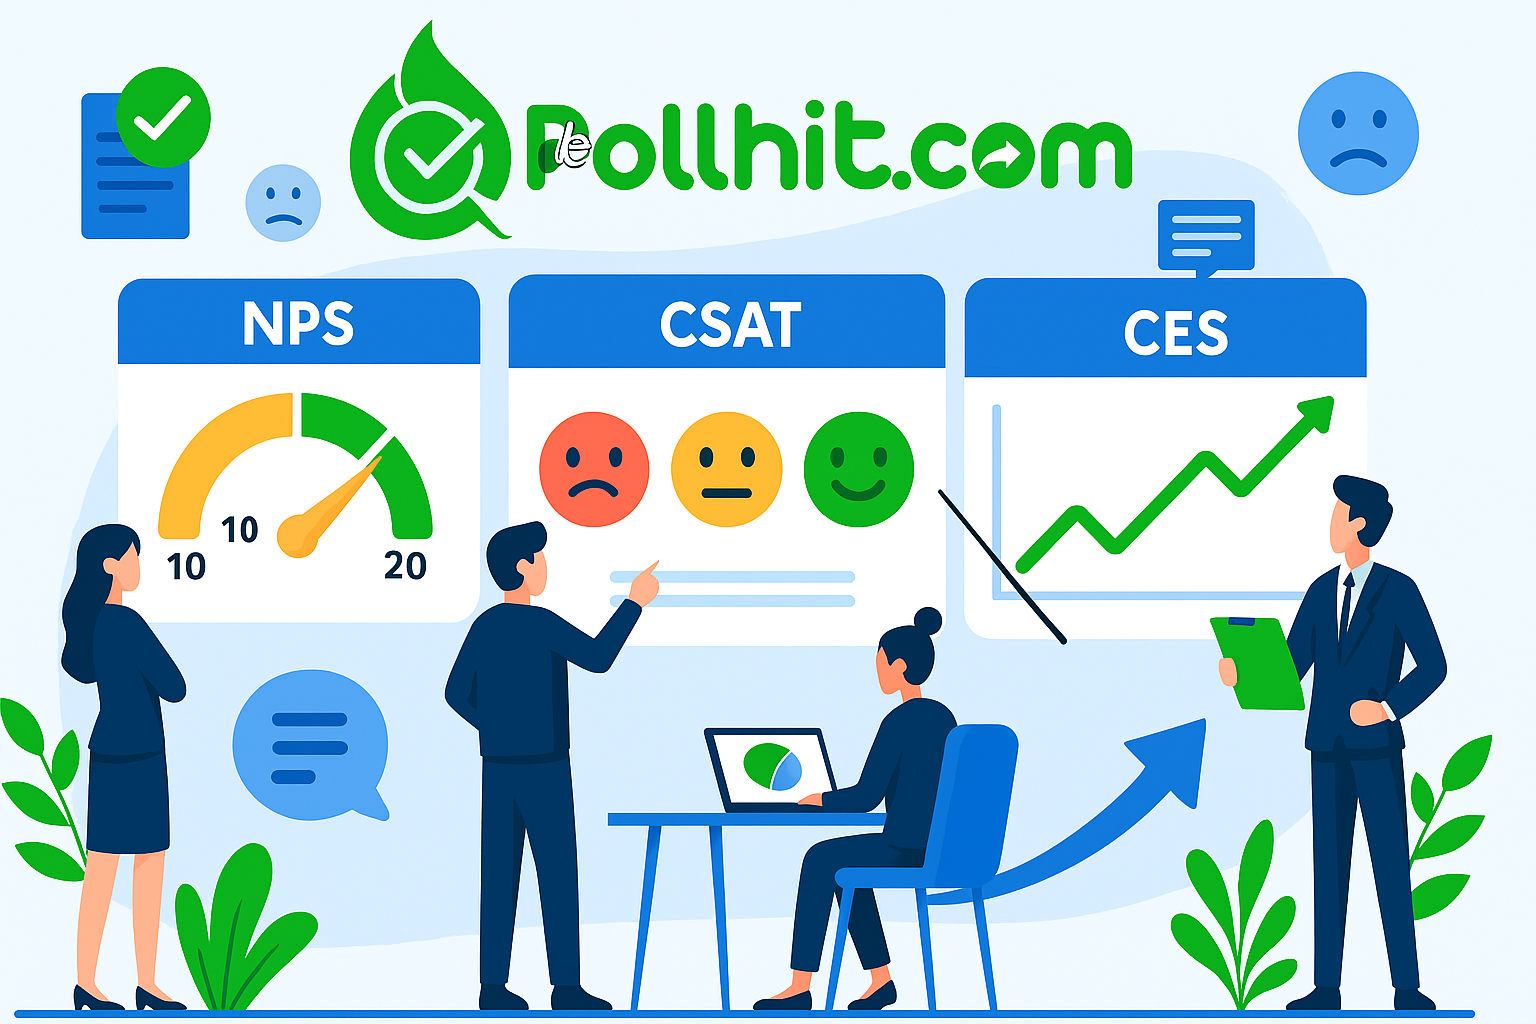
1. Net Promoter Score (NPS)
NPS measures the likelihood of users recommending your product or service to others.
- Benchmark: A good NPS in 2025 varies by industry but generally falls between 30 and 70.
- How to Improve: Focus on improving usability, onboarding, and support.
2. Customer Satisfaction Score (CSAT)
CSAT is a direct measure where users rate their satisfaction with a product or service.
- Benchmark: Aim for 80% and above for high-performing platforms.
- How to Improve: Use real-time support and proactive communication.

3. Customer Effort Score (CES)
CES assesses how easy it was for users to complete an action or solve an issue.
- Benchmark: Lower scores indicate better experiences; aim for under 2.0.
- How to Improve: Reduce friction in UX/UI and provide clear guidance.
4. Task Success Rate
Measures how effectively users can complete core functions of your product.
- Benchmark: 90%+ for critical user journeys (e.g., checkout, sign-up).
- How to Improve: Conduct usability testing and streamline flows.
5. Response Rate to Surveys
Your survey participation rate is a direct reflection of how engaged your user base is.
- Benchmark: 20%-30% is standard; aim for 35%+ with incentives.
- How to Improve: Keep surveys short, mobile-optimized, and timely.
How to Collect These Metrics Effectively Using PollHit
Why Use PollHit?
PollHit is a powerful platform for running user satisfaction surveys that generate actionable data with minimal setup.
Features That Enhance Metrics Collection:
- Pre-built templates for CSAT, NPS, CES
- Real-time analytics dashboard
- Multi-channel distribution (email, SMS, web)
- GDPR-compliant privacy protocols

Internal Links You Should Use:
Benchmarks by Industry
SaaS Platforms
- NPS: 40-60
- CSAT: 85%
- CES: 1.8
E-commerce
- NPS: 30-50
- CSAT: 80%
- CES: 2.0
Education/EdTech
- NPS: 50-70
- CSAT: 90%
- CES: 1.5
Compare industry NPS benchmarks

Best Practices for Benchmarking in 2025
1. Segment Your Audience
Track results across user types: new users, loyal customers, and churned users.
2. Automate Survey Triggers
Use behavioral triggers to launch relevant surveys—e.g., post-purchase, post-support.
3. Benchmark Against Past Performance
Don’t just compare with competitors. Measure your growth month-over-month.
4. Visualize Data
Use charts, heatmaps, and word clouds to uncover patterns in feedback.
5. Follow Up on Negative Feedback
Respond to Detractors in your NPS to rebuild trust and prevent churn.
How to Turn Benchmarks into Business Wins
Use Feedback for Product Roadmapping
If CES scores are low, prioritize fixing friction points in UX/UI design.
Enhance Customer Success Strategies
CSAT and NPS can help shape onboarding, support, and community-building efforts.
Demonstrate ROI to Stakeholders
Benchmark data strengthens business cases for budget allocation and strategy shifts.
Conclusion
Understanding and acting on the right user satisfaction survey benchmarks is essential for growth in 2025. With tools like PollHit, collecting, analyzing, and leveraging this data is more efficient than ever.
Ready to improve user satisfaction? Start your survey now with PollHit and turn data into meaningful progress.